
If you have done any browser-based scraping, you have already used a network inspector. You opened DevTools, watched the Network tab, found the XHR that returned the JSON you wanted, copied it as cURL, and moved on. That works right up until the site is behind an anti-bot. Then the exact same request that worked in your browser returns a 403, and nothing in DevTools tells you why.
This post is about the tool we reach for when that happens: powhttp. We keep recommending it, and it barely has any documentation, so we kept having to explain the same things over and over. This is that explanation, written down once, so you can read it instead of asking us.
We will cover why request-based scraping needs a different kind of inspector than DevTools, how to install powhttp on Windows and macOS, how to record both your script and your browser, how to search a session to find where dynamic values come from, how to diff and replay requests, how to route traffic through an external proxy, and how to hand a capture to our HAR analyzer or the Claude Code plugin so an AI reads it for you.
Key Takeaways
- DevTools can't show the three things modern anti-bots fingerprint: your TLS fingerprint, your header order, and exact header case and values. powhttp captures the real wire, in the exact order and case it went out.
- powhttp barely touches your TLS fingerprint, unlike Charles, so you debug your scraper instead of the proxy corrupting the capture.
- The core loop: record the browser, search the session for the dynamic tokens a request depends on, then diff your script against the browser wire-to-wire until the diff is empty.
- Hand the capture to the HAR analyzer or the Claude Code plugin's MCP server and let AI read the wire for you instead of eyeballing header lists.
If you come from browser-based scraping, start here
A browser-based scraper drives a real browser (Playwright, Puppeteer, Selenium). The browser produces a genuine TLS handshake and genuine headers, so anti-bots mostly leave the shape of the traffic alone. You pay for that with bandwidth and speed: every run loads the whole page, all the JS, images, and XHR, and you pay residential proxy rates on all of it.
Request-based scraping throws the browser away and sends raw HTTP requests straight to the JSON API the page was calling anyway. It is dramatically cheaper and faster (our open-source Hermès scraper pulls the entire US catalog at about 37 KB per product this way). But now you are responsible for producing traffic that looks like a browser, because the anti-bot is no longer watching a real one.
Here is the part that trips up everyone coming from the browser world:
Finding the API endpoint is the easy 20%. Making your request look identical to the browser's is the other 80%, and it is invisible in DevTools.
Using DevTools to find an endpoint teaches you what to request. It teaches you nothing about how the request has to look, because DevTools shows you a cleaned-up, re-sorted, human-friendly view of the request; not the bytes that actually went out. Modern anti-bots (Akamai, DataDome, Incapsula, Kasada) fingerprint exactly the things DevTools hides.
The three signals DevTools can't show you
- TLS fingerprint. Before a single header is sent, your TLS ClientHello already tells the server whether you are Chrome or a Python script.
requests,axios, andnet/httpall have non-browser fingerprints and get flagged instantly. DevTools never shows this at all. - Header order. Not which headers you send, the order you send them in, including the HTTP/2 pseudo-header order (
:method :authority :scheme :pathfor Chrome). DevTools alphabetizes headers for display, so the order you copy is not the order Chrome used. Send them alphabetically and you are flagged before the server reads a single value. - Header case and exact values. HTTP/2 uses lowercase header names; HTTP/1.1 uses Title-Case. Even a value like
accept-encodinghas to match exactly (Chrome sendsgzip, deflate, br, zstd, notgzip, deflate, br). Copy these slightly wrong and they stop matching a real Chrome.
We have written the deep dives on why header order is not enough on its own and TLS fingerprinting. The point for this post is simpler: you cannot fix what you cannot see, and DevTools cannot show you any of the three. You need a proxy that captures the real wire.
What powhttp actually is
powhttp is a local HTTPS debugging proxy. You point traffic at it (by default http://127.0.0.1:8080), it decrypts the TLS using its own trusted root certificate, and it records every request and response, showing you headers in the exact order and case they went out on the wire. It runs on Windows and macOS.
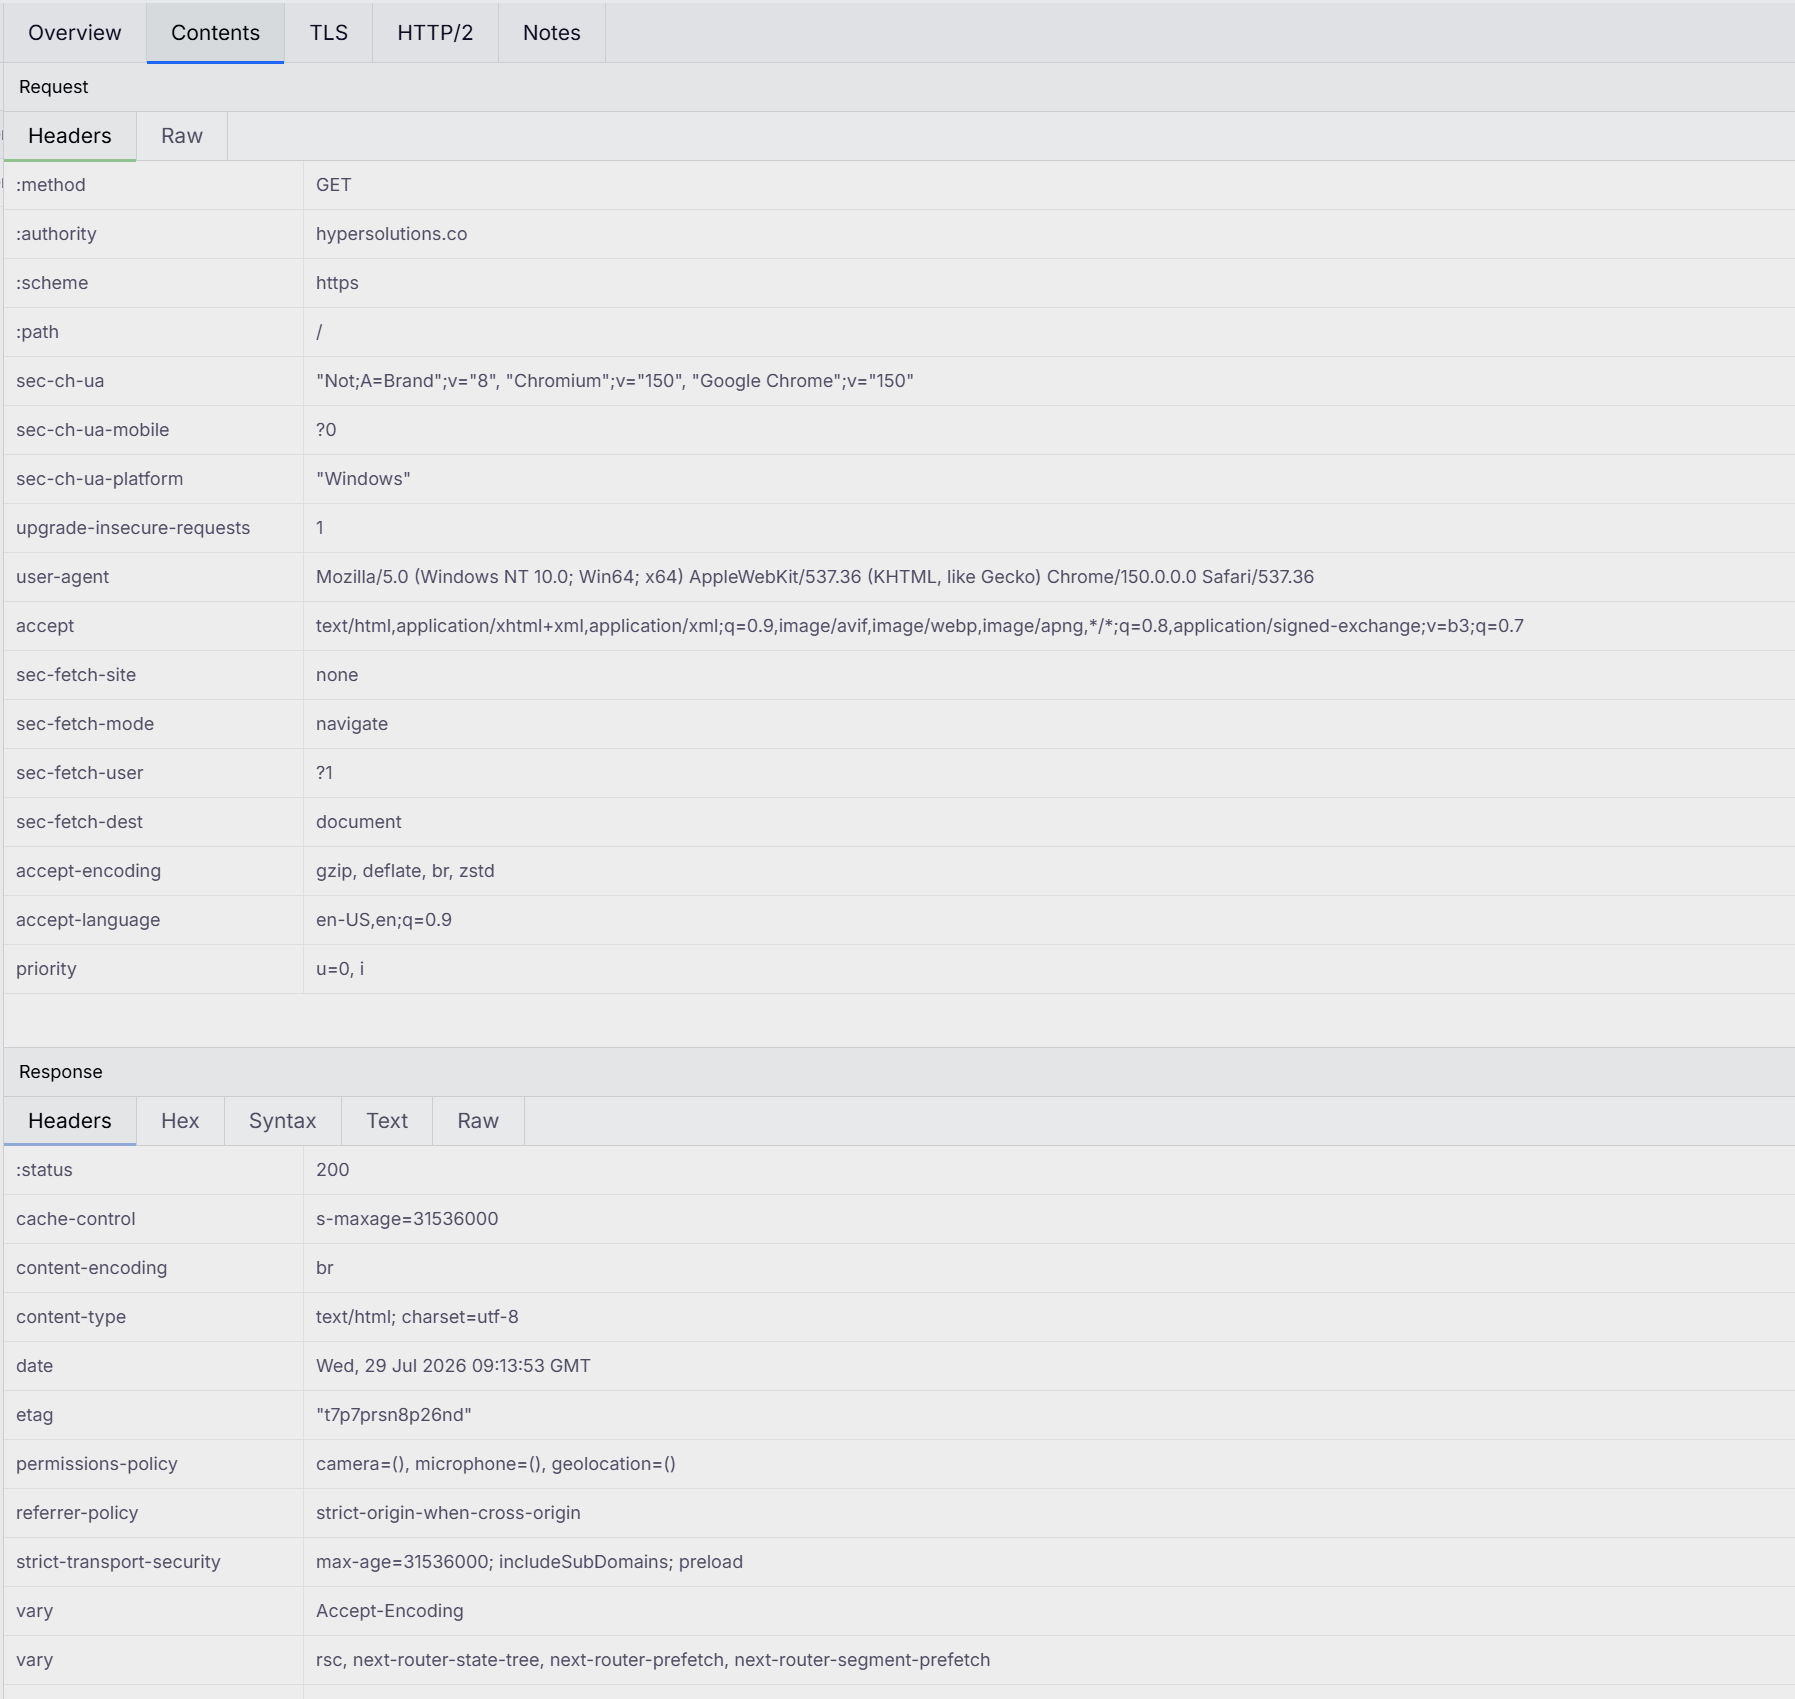
If you have used Charles, Fiddler, Proxyman, mitmproxy, or Reqable, it is the same category of tool. We reach for powhttp specifically because of three things that matter for anti-bot work:
- It barely touches your TLS fingerprint. This is the big one. Charles rewrites the ClientHello enough that some anti-bots block Charles itself, which means you can't even record the flow you're trying to debug. powhttp's interception preserves the original algorithms and parameters, so what you capture is what your client really sent. You are debugging your scraper, not the proxy.
- It shows the true wire order. Header order, header case, and HTTP/2 pseudo-header order, exactly as sent. This is the whole reason the tool exists for us.
- Its external-proxy support is first-class. You can chain powhttp to an upstream proxy without it corrupting the capture. (Charles' "External Proxy" feature, by contrast, quietly moves
Content-Lengthto the bottom of the header block, corrupting the very ordering you are trying to inspect.) More on why this matters below.
It is not perfect: it's still in beta, a few corners of the UI are rough, and the documentation is thin, which is half the reason for this post. But the parts that matter for this work are solid, including Wireshark-style filtering to narrow a busy session down to the requests you care about, and none of the rough edges outweigh having an honest view of the wire.
Install it
powhttp is in free beta. Download it from powhttp.com and install for your platform.
Windows. Run the x64 installer. On first launch, powhttp installs and trusts its root certificate so it can decrypt HTTPS. Accept the certificate trust prompt; without it every HTTPS site will show a certificate error.
macOS. Install the macOS build and launch it. Same idea: powhttp installs its root certificate into the system keychain. macOS will ask you to approve it; you may need to open Keychain Access and set the powhttp certificate to Always Trust if a site still shows an error. On Apple Silicon, use the native arm64 build.
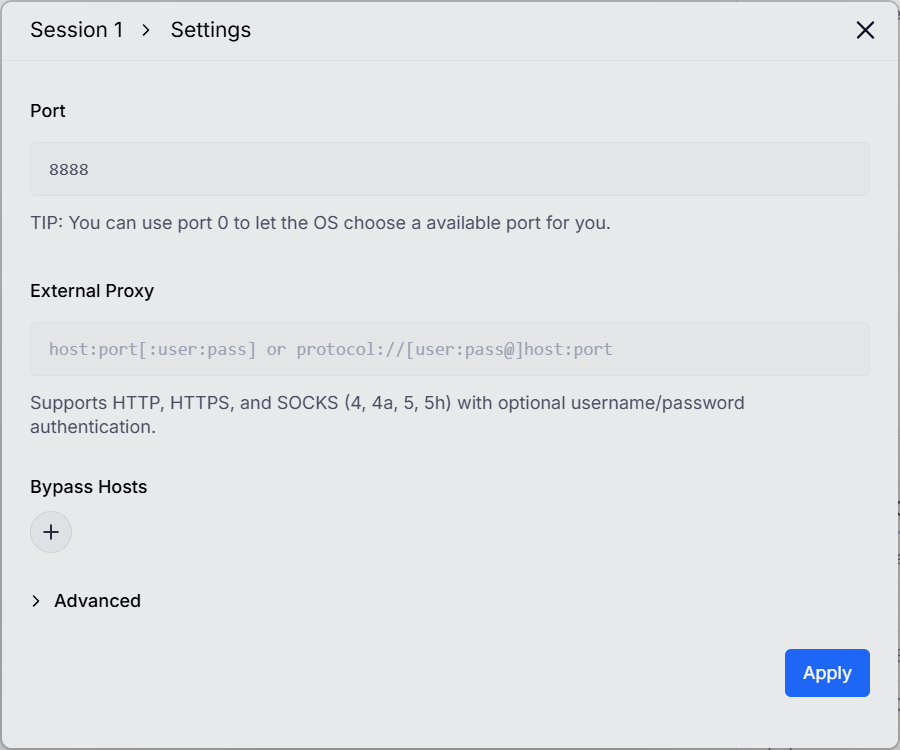
Once it is running, open a session and you get a local capture proxy on http://127.0.0.1:8080 by default. The port is configurable per session (the screenshots in this post use a custom 8888, which is why you'll see that number in them). Everything below flows through that address.
Before you record, get oriented with the session toolbar:
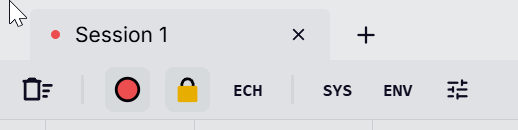
Three controls matter. The record button (the red dot) has to be active or nothing is captured. The lock icon toggles TLS decryption and needs to be on, otherwise you capture opaque HTTPS you can't read into. And SYS registers powhttp as the system proxy for the whole machine, which is the one button you generally want to leave off, for the reason in the next section.
Record your script's traffic
This is the common case: your scraper is getting blocked and you want to see what it is actually sending.
Point your HTTP client at powhttp as its proxy, and trust powhttp's root certificate so the client accepts the intercepted TLS (import the cert powhttp installed into your trust store, rather than disabling verification). In Go with bogdanfinn/tls-client that looks like:
jar := tlsclient.NewCookieJar()
options := []tlsclient.HttpClientOption{
    tlsclient.WithClientProfile(profiles.Chrome_150), // match the Chrome you captured
    tlsclient.WithNotFollowRedirects(),
    tlsclient.WithCookieJar(jar),
    tlsclient.WithTimeoutSeconds(30),
    tlsclient.WithRandomTLSExtensionOrder(),
    tlsclient.WithDisableHttp3(),
    tlsclient.WithProxyUrl("http://127.0.0.1:8080"), // route through powhttp
}
client, err := tlsclient.NewHttpClient(tlsclient.NewNoopLogger(), options...)
That's the profile shape we recommend everywhere: the latest Chrome profile, a real cookie jar, randomized TLS extension order, and HTTP/3 disabled (most proxies don't speak it yet).
The equivalent in other stacks:
- Python:
proxies={"http": "http://127.0.0.1:8080", "https": "http://127.0.0.1:8080"}(and pointverifyat powhttp's cert). - Node: set the agent/dispatcher to
http://127.0.0.1:8080.
Route through the proxy port directly from your code like this, not through powhttp's SYS (register as system proxy) button. SYS captures everything on the machine, so your view fills up with noise from Slack, Spotify, and every other app phoning home. Pointing your client straight at the session port keeps the capture to just your scraper.
Then run your scraper. Every request it makes shows up in powhttp in wire order. Read your blocked request and check the usual suspects, in the order we check them:
- Headers in alphabetical order (a dead giveaway that they came from a map/dict, not a browser).
- Wrong case for the protocol (Title-Case on HTTP/2, or lowercase on HTTP/1.1).
prioritynot sent last on HTTP/2, or aHostheader present on an HTTP/2 request.- A missing or misplaced
cookieheader. sec-ch-uaoraccept-encodingthat doesn't exactly match a real Chrome.
A crucial detail people miss: header order is per-request-type. A navigation request, an XHR, a script subresource, and the anti-bot's own endpoint each have their own order. Capture the specific request you are replaying, not a generic one.
Record your browser's traffic
You cannot match the browser if you have not captured the browser. This is your source of truth, the thing your script's requests have to become.
Same rule as your script: don't route the browser with the SYS system-proxy button, or you'll bury the session in traffic from every other app. Route just the browser instead. The cleanest way is a per-browser proxy extension like Proxy Switcher, pointed at the session port (127.0.0.1:8080), so only that browser's traffic reaches powhttp. Then navigate to the target site and let it run the full flow. Two things to get right while recording:
- Turn off DevTools "Disable cache" if you have DevTools open. That setting injects two non-browser headers (
Cache-Control/Pragma) that a real navigation doesn't send, and you'll copy them into your script by mistake. - Record from a clean profile. A browser profile that already holds state produces polluted captures: extra Client Hints on the first request, storage-access artifacts from incognito, and so on. We wrote a whole post on why bad captures still get blocked; the short version is to record from a fresh, normal Chrome profile, not incognito, and not a profile that only had its cookies cleared.
Search a session to find where dynamic values come from
Here is where request-based scraping really diverges from "find the endpoint in DevTools." The request you actually want usually carries a value that was minted somewhere earlier in the flow, and if you don't reproduce whatever produced it, your script can never make a valid call.
Take a real example: an airline's flight-search request carries a long token, sent as a reese84 cookie (and echoed as an x-d-token header on the JSON API call). That token is Imperva/Incapsula's reese84 protection. If all you did was find the search endpoint, you'd have no idea that value exists to be earned, let alone where it comes from.
powhttp's search fixes that. Copy the token value and search the whole session for it, powhttp matches across URLs, headers, and bodies. As the screenshot shows, the same value turns up in three places: the earlier request whose response body first minted it, the reese84 cookie on the search page, and the x-d-token header on the API call.
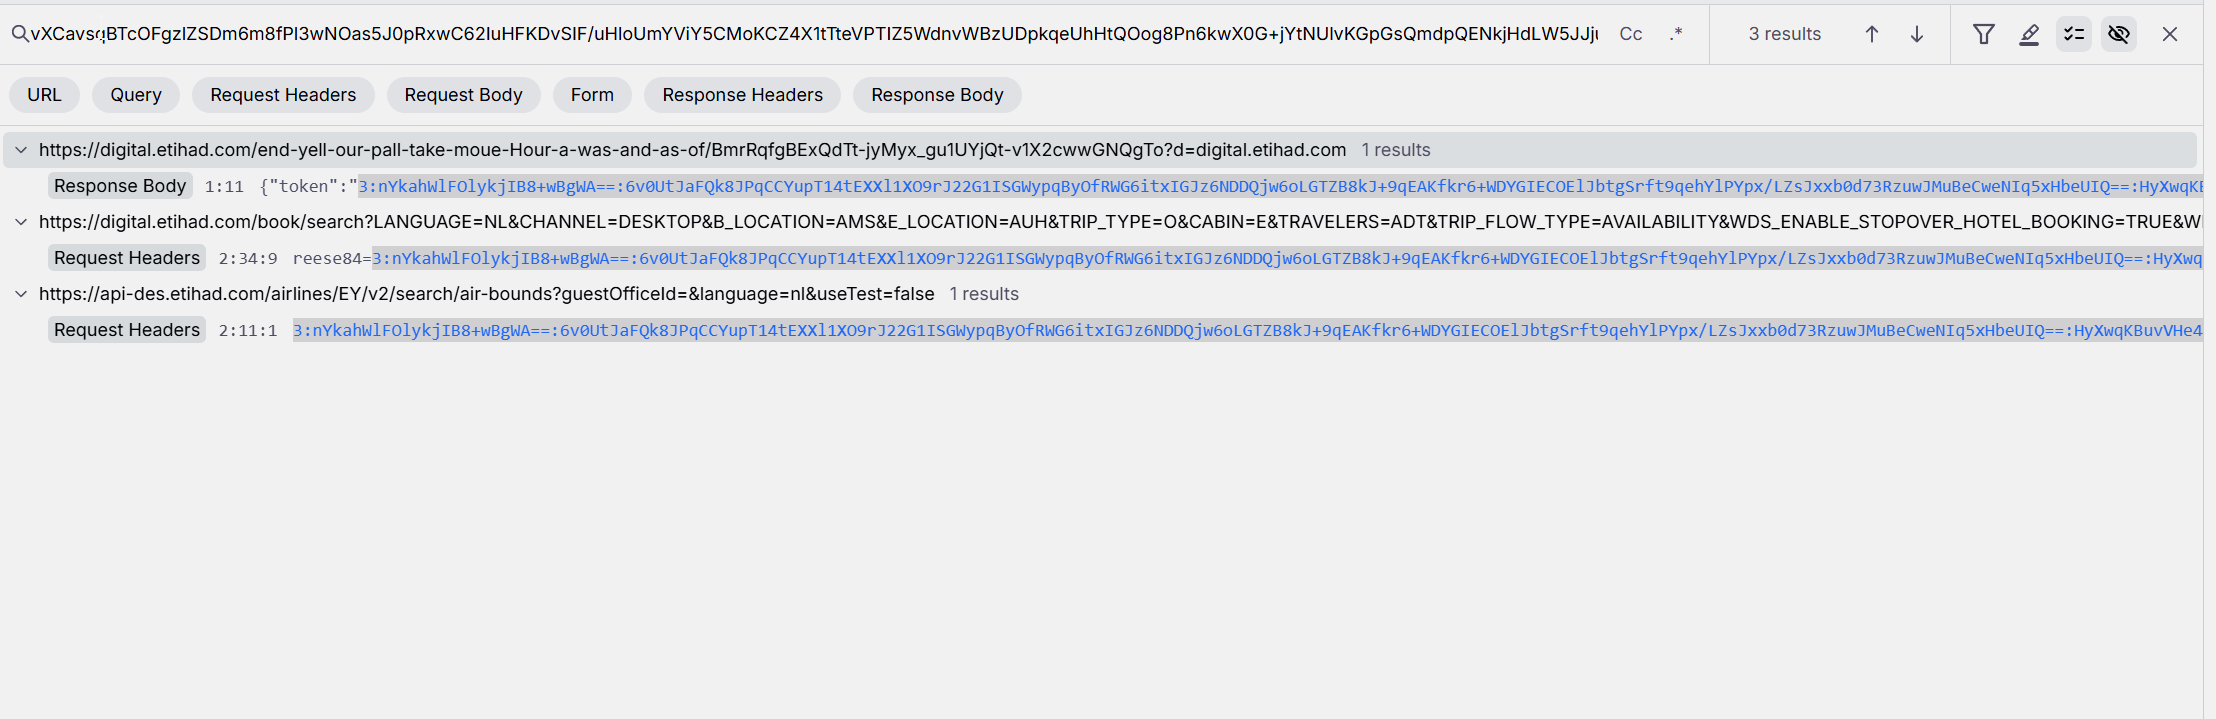
Now you know the real dependency chain: to call the search endpoint, your script first has to make the requests that mint x-d-token. Do this for every dynamic value on the request you care about (tokens, cookies, CSRF headers, signed query params) and you've reverse-engineered the exact set of requests your script has to make, and in what order. That map is the actual output of reading a browser session; the endpoint was just the destination.
Compare requests with the built-in diff
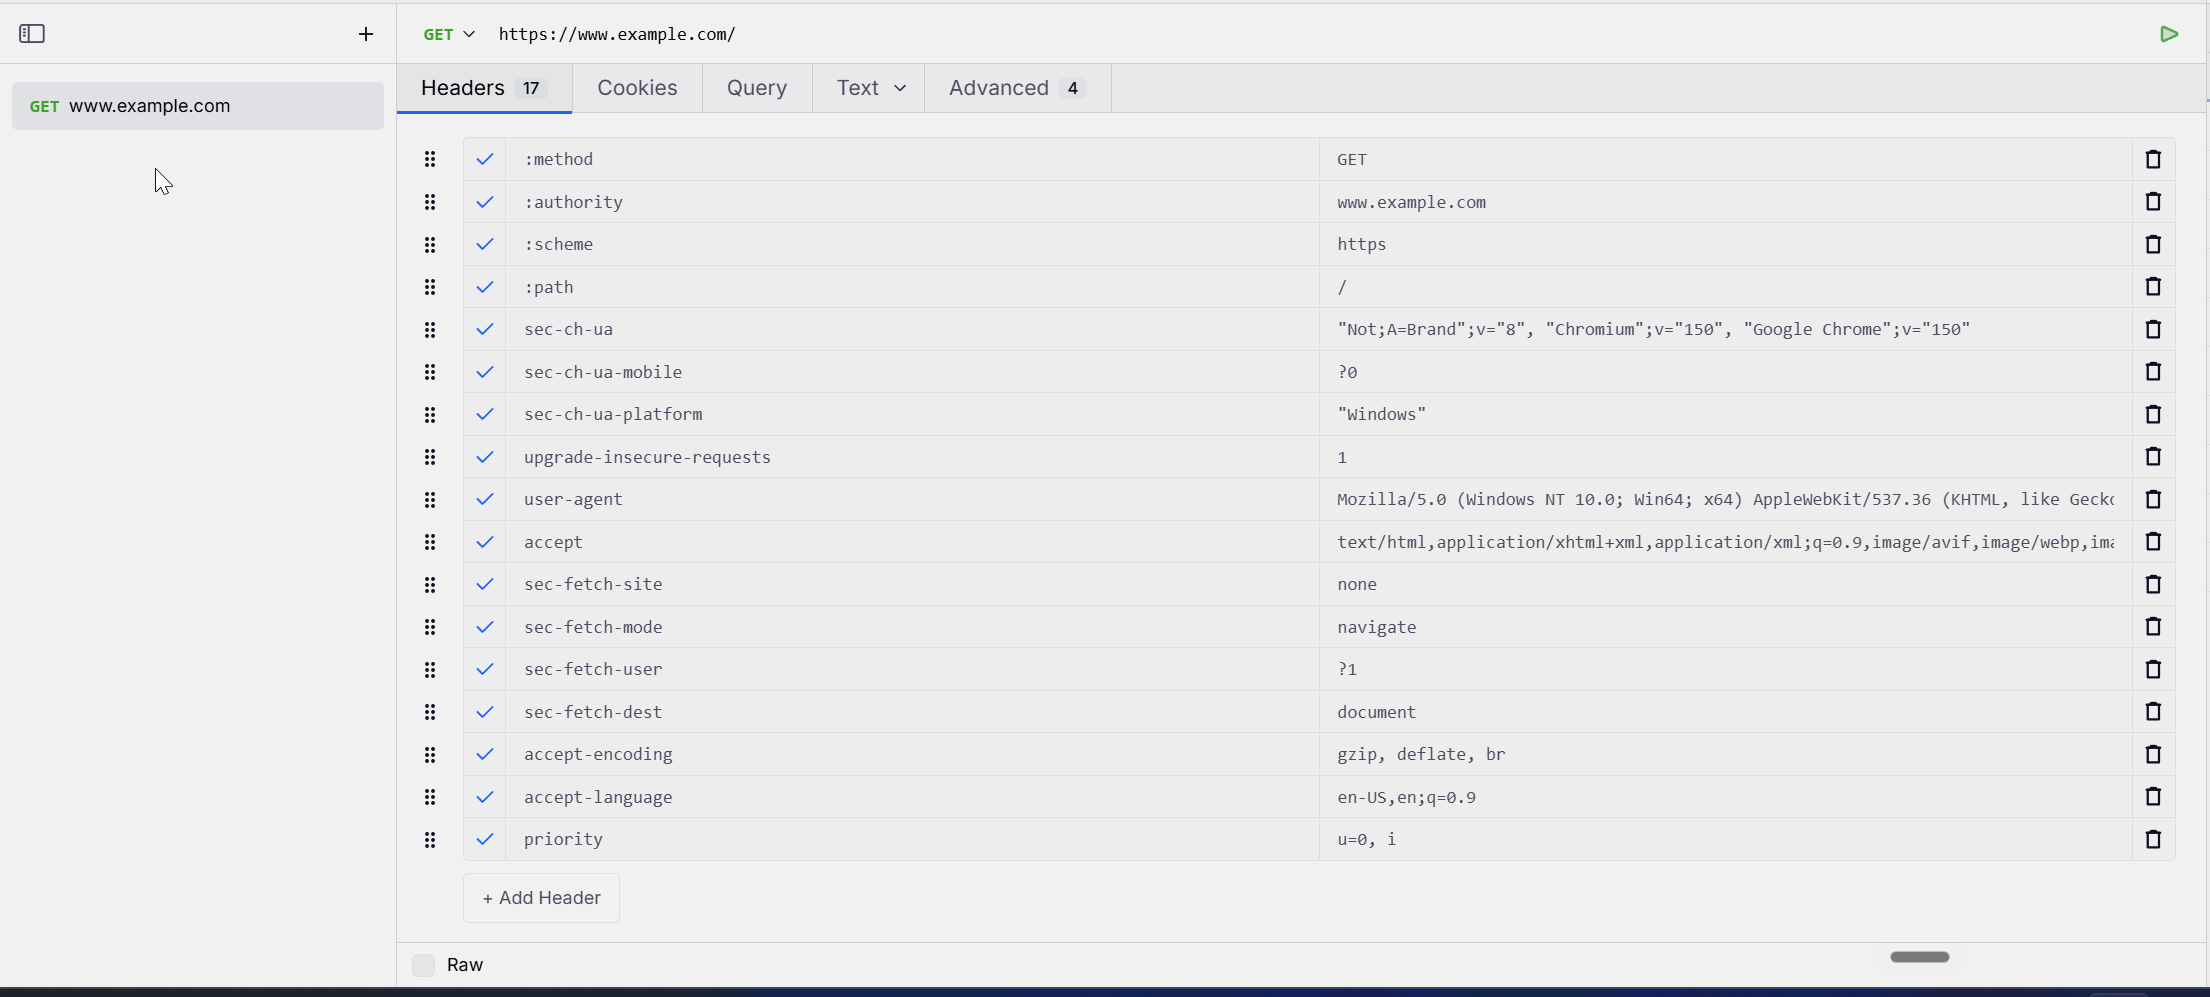
Once you have the browser's request and your script's attempt for the same endpoint, the job is to make them identical: same headers, same order, same case, same pseudo-header order. powhttp has a built-in diff view for exactly this. Ctrl-select the two entries and press Ctrl+Shift+D, or right-click each and choose Compare Entry (A) then Compare Entry (B) from the context menu. Either way powhttp lays them side by side in wire order.
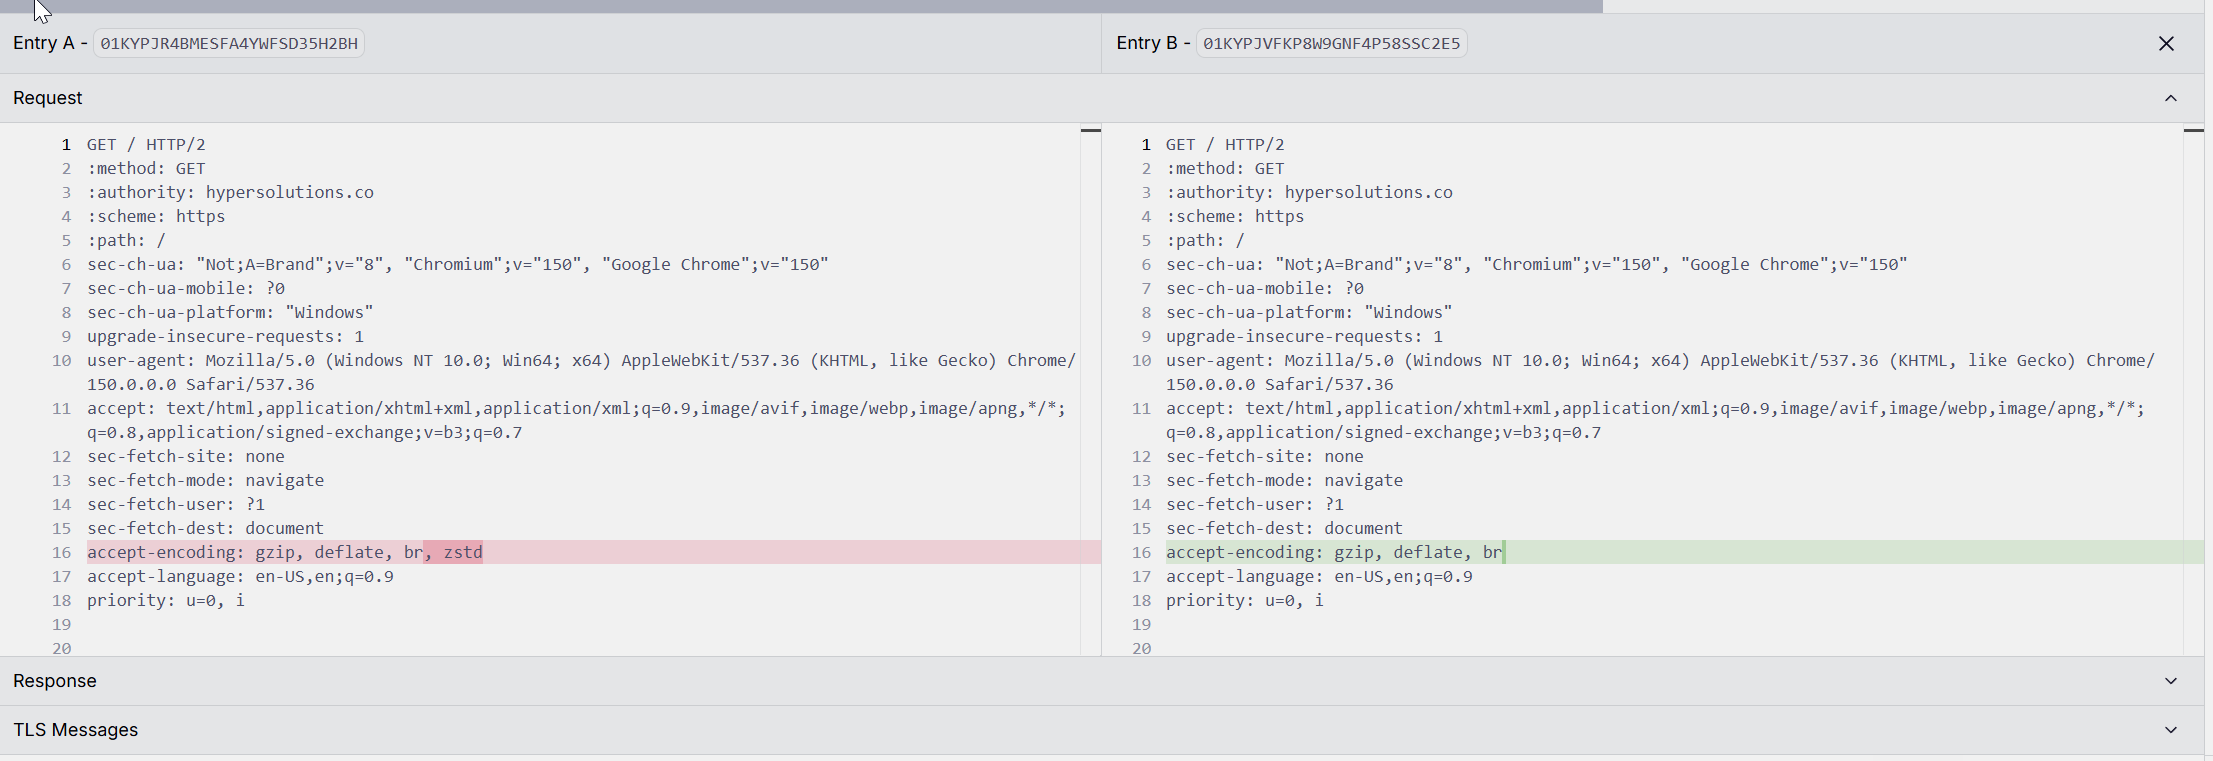
Here the two requests are almost identical, and the diff catches the one thing that isn't: accept-encoding. The script sends gzip, deflate, br; Chrome sends gzip, deflate, br, zstd. Chrome has advertised zstd since Chrome 123, so a request missing it no longer looks like current Chrome. That is precisely the kind of one-token difference a naked eye scanning two header lists skips over, and precisely the kind an anti-bot notices.
When the diff shows a difference, fix it in your client:
- Wrong order → declare the order explicitly. In Go's
fhttpthat'shttp.HeaderOrderKey(regular headers) andhttp.PHeaderOrderKey(pseudo-headers). Don't let a map decide the order. - Wrong TLS shape → use a browser-grade TLS client with the latest Chrome profile, HTTP/3 disabled, and random extension order enabled.
- Wrong header value → copy the exact string the browser sent,
accept-encodingandsec-ch-uaincluded.
Iterate until the diff is empty. That is the finish line.
Composer and replay
Two features that pay off once your requests are close.
The composer lets you send a request without touching your scraper. Open it from a captured request and it prefills with that request's method, URL, headers, and body; or start from a blank one and build it by hand. Either way it's the fastest way to test a hunch: change one header, resend, see if the block clears.
Replay re-fires a captured request as-is, one click per request. Beyond spot-checking, it answers a question that matters for real scrapers: how long is a session good for? Take a search request that returned 200 on a warm session and replay it, again and again, one click at a time. Watch for the point where the response flips from 200 to 403. That's the moment the token or cookie stopped being trusted, and it tells you how many calls a single session survives before you have to rotate it, exactly the kind of thing that decides how you pool sessions in an airline scraper (how many searches one Akamai or reese84 cookie is good for).

Set your session-rotation threshold a little below that number and you keep sessions alive without pushing any single one until it dies.
Route through an external proxy
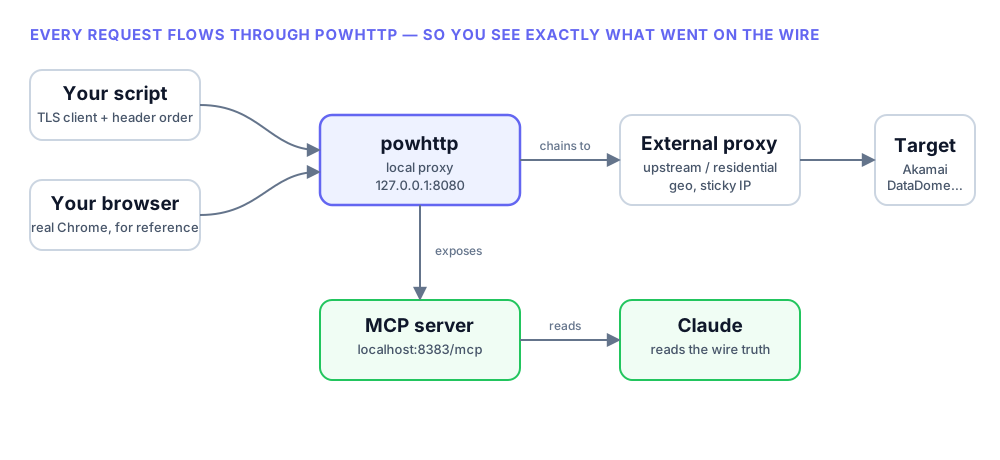
powhttp can chain to an upstream (external) proxy: instead of connecting to the target directly, it forwards through another proxy first. You capture the traffic locally, but it exits over whatever proxy you configured, HTTP(S) or SOCKS. Each powhttp session binds to its own proxy port and its own upstream, so you can keep a direct session and a proxied session open in different tabs at once. Point the upstream at the exact proxy your scraper uses.
Two situations where this turns a guessing game into a five-minute answer:
1. You're geo-blocked. The target only serves the content (or only runs the anti-bot flow) from certain countries, and you're recording from the wrong one. Set your in-country residential proxy as powhttp's upstream, and your capture now comes from an IP the site actually serves. You're inspecting the real flow, not a geo-gate.
2. Your script works on one proxy but fails on another. This is the big one, because it isolates a question that otherwise costs you hours: is it the IP, or is it my code? Set the failing proxy as powhttp's upstream and run your script through it, so you see exactly what the target returns over that IP. Then, keeping the same upstream, point your browser at powhttp and load the site by hand:
- If the browser also gets blocked over that IP, it's the proxy. The IP is flagged, or its geo/ASN is wrong. No amount of code fixing helps; change proxies.
- If the browser sails through but your script is blocked over the same IP, it's your code. Go back to the diff, because the difference is in your headers, order, or TLS, not the network.
That single test, same IP, browser vs. script, in one tool, is the fastest way we know to stop chasing the wrong problem.
One consistency rule while you're here: the IP powhttp exits from should be the same IP your scraper (and any sensor-data API) uses. Use sticky session proxies, never rotating ones, so the IP the target sees matches the IP the rest of your stack thinks it's on.
Export a HAR and let the analyzer read it
powhttp can export a session (or a selection) as a HAR file. Two good uses.
First, sharing: if you ask for help, a powhttp HAR is the artifact to send, because it preserves the real wire header order that a HAR from DevTools or Charles normalizes away.
Second, automated review. In the Hyper Solutions Discord (discord.gg/akamai), hit Check my HAR and upload your powhttp export; the analyzer replies with the concrete issues it found, sorted into confirmed, warnings, and info, each with a category and a suggested fix. In the example below it flags one confirmed issue, the same accept-encoding missing zstd from the diff section, plus an info note that the capture is on the previous stable Chrome, without you having to spot either by eye.
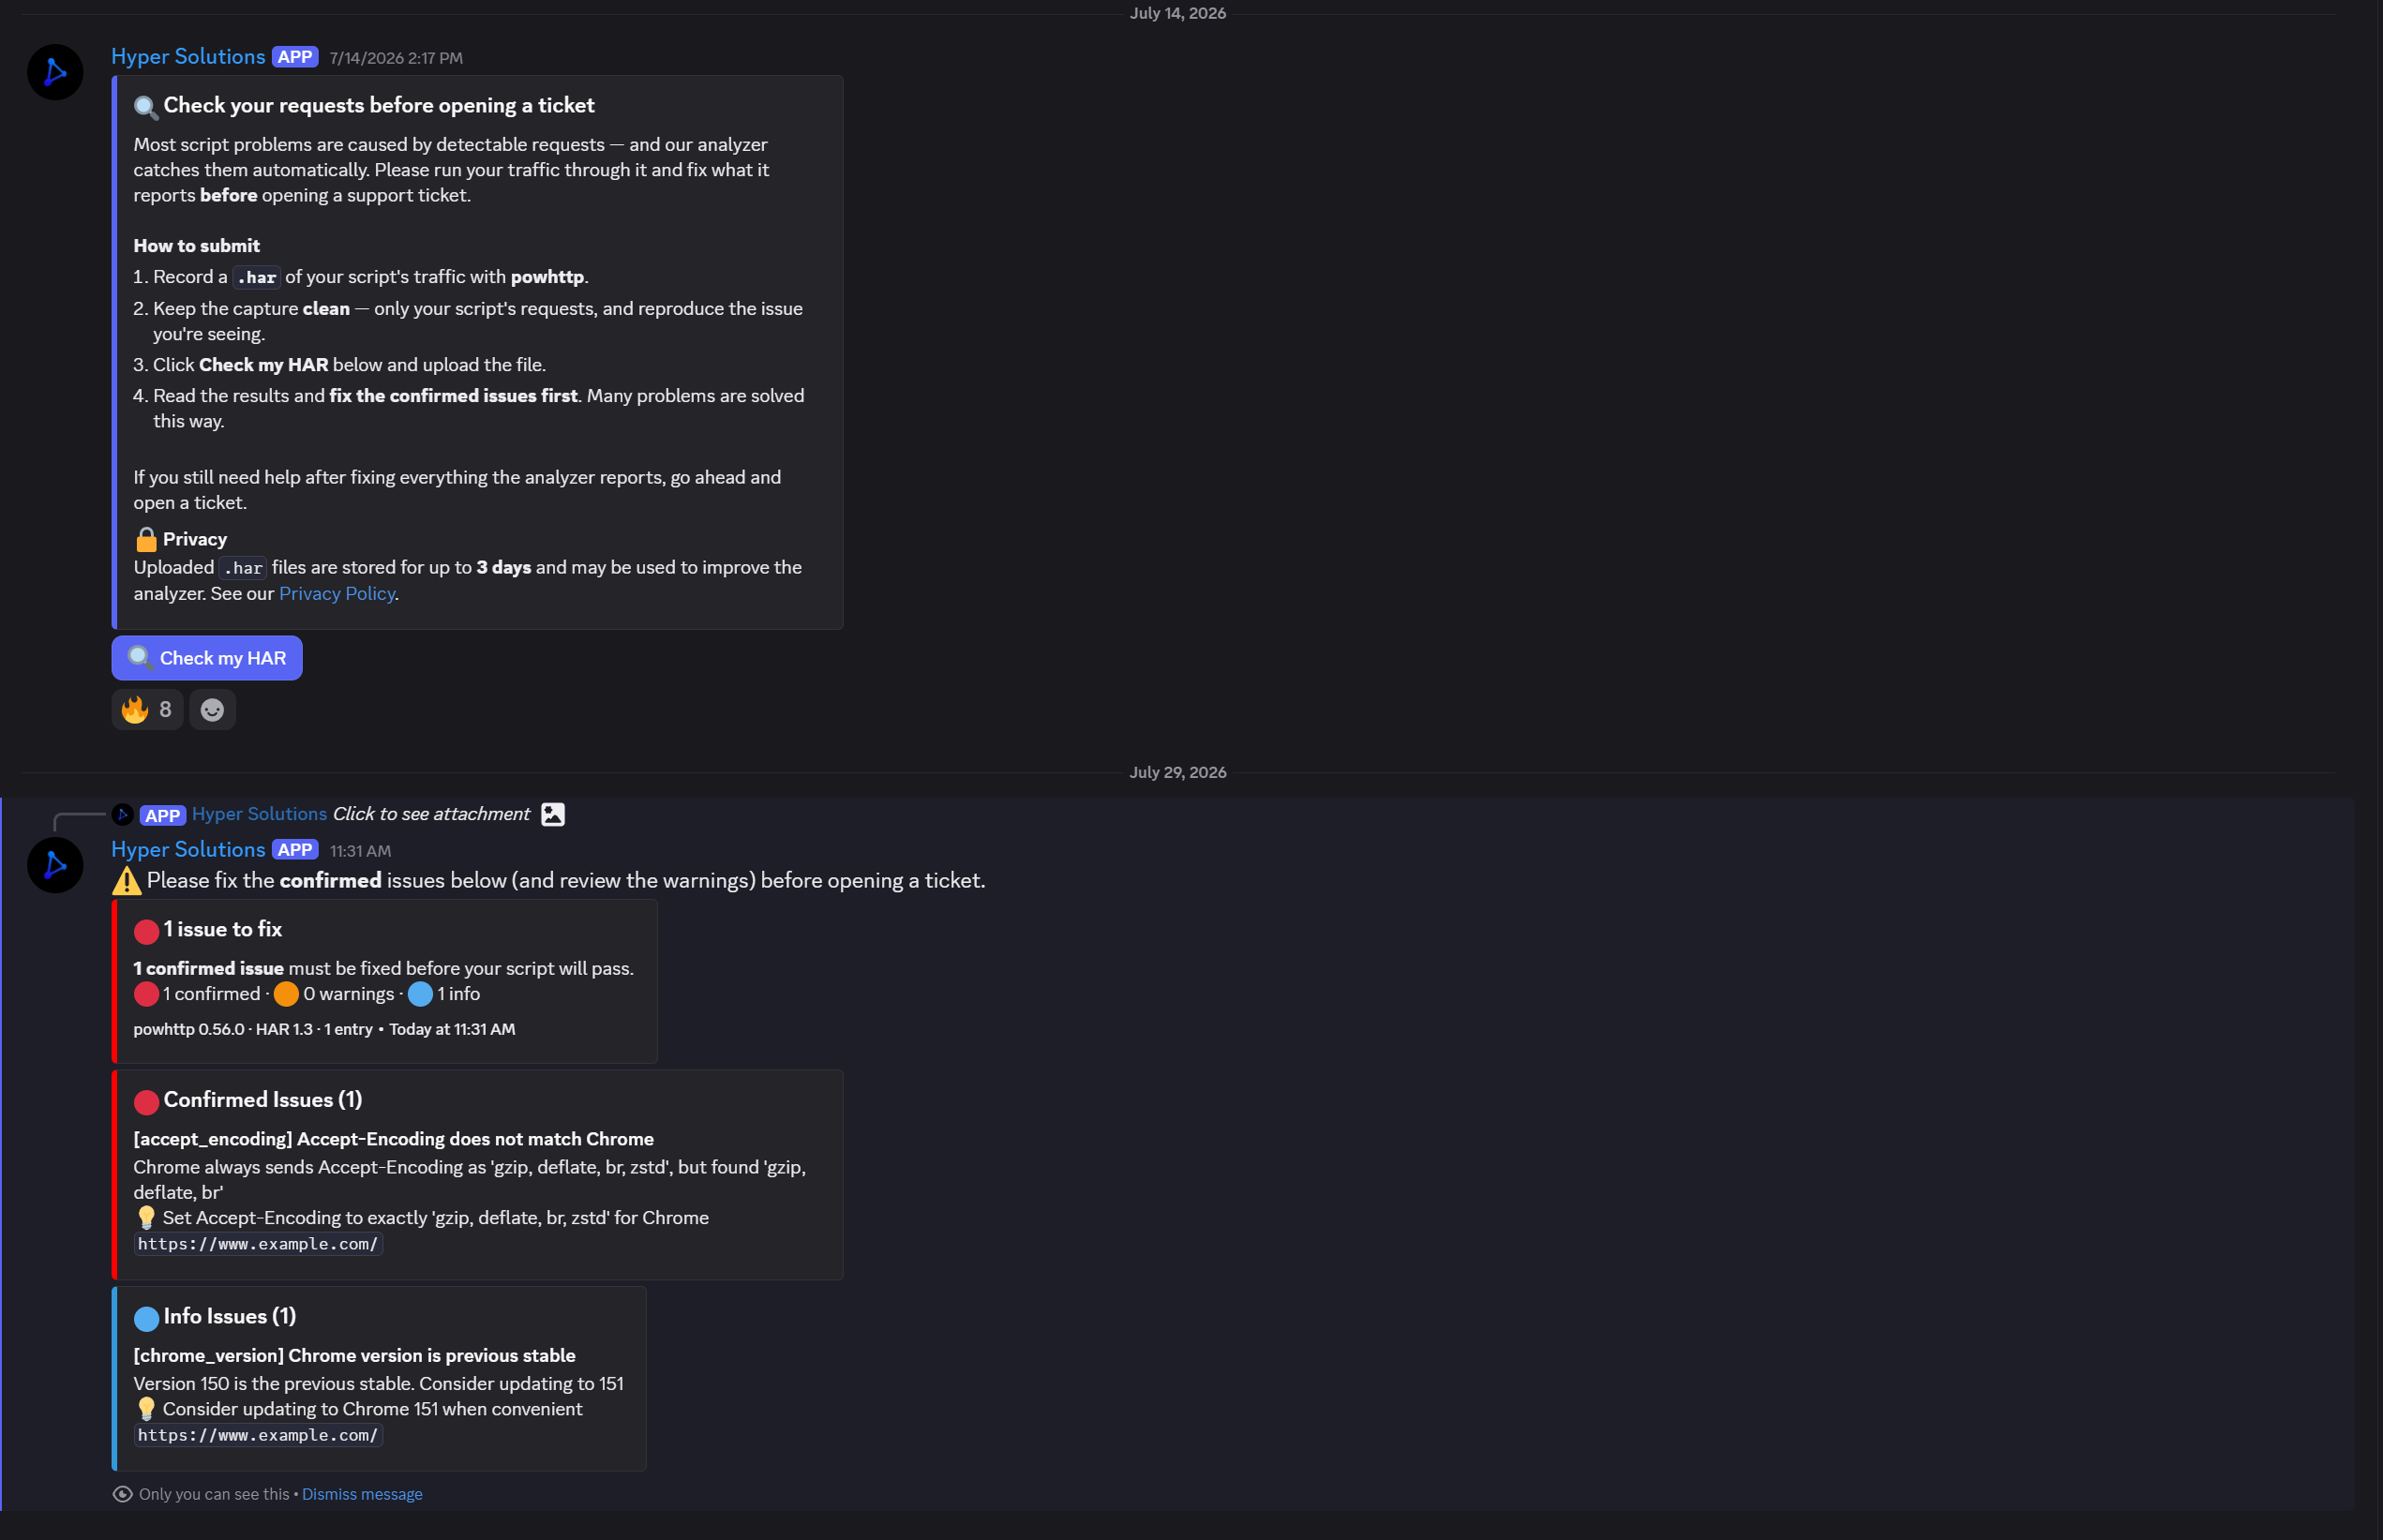
Because the HAR came from powhttp, the analyzer's header-order and case findings are trustworthy; run the same file from a debugger that normalizes order and those findings can't be trusted. The same maintained rule set is bundled in the Claude Code plugin's HAR analyzer, if you'd rather run it locally instead of in Discord.
Pair it with the AI plugin and its MCP server
powhttp can hand its live capture to Claude, so instead of eyeballing header lists yourself you let the model read the wire and tell you what's wrong. This is the same setup behind our Claude Code plugin demo, where Claude one-shot a full airline scraper by reading the real traffic.
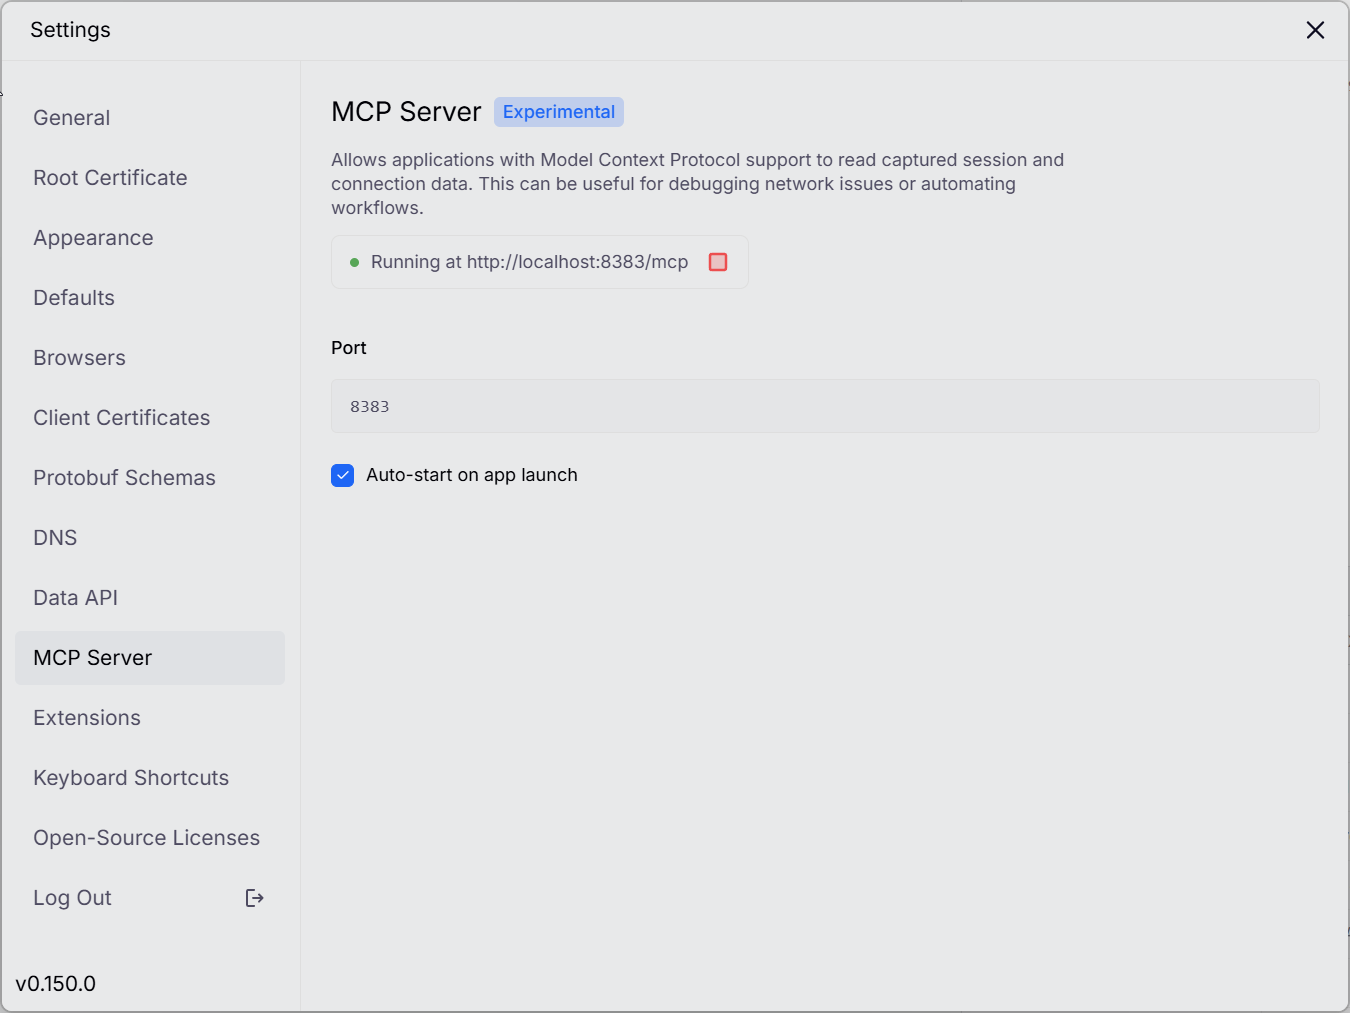
Open powhttp's Settings → MCP Server and start it (it's marked experimental, and there's an Auto-start on app launch toggle if you want it always on). It exposes the captured session over MCP at http://localhost:8383/mcp.
Then install the plugin in Claude Code, which bundles the powhttp MCP, the HAR analyzer, and the Hyper Solutions integration skill:
/plugin marketplace add Hyper-Solutions/hypersolutions-claude-code
/plugin install hypersolutions@hypersolutions
Now Claude can read your capture directly. Under the hood the MCP exposes three tools:
find_requests: query the captured session (filter by URL, headers, or body) and return requests with their headers in wire order.get_tls_connection: the TLS handshake for a connection, so the model can confirm your ClientHello matches Chrome at the JA3/JA4 level.get_http2_streams: the raw HTTP/2 frames, so it can read the actual pseudo-header order.
In practice you record your failing flow through powhttp, then ask Claude something like "my request to the search endpoint is getting a 403, compare it against the browser's request in the active session and tell me what's off." It reads both from the capture, spots the order/case/TLS mismatch, and points at the exact header to change; the same diff you'd do by hand, done for you. There's a Codex build too; the full rundown is on the plugins page.
The workflow, start to finish
Putting it together, the loop we run for any new request-based target:
- Record the browser flow through powhttp from a clean profile. Find the JSON endpoint you actually want.
- Search the session for each dynamic value on that request to map the chain of requests that produce it. That chain is what your script has to reproduce.
- Write a first pass in a browser-grade TLS client, pointed at powhttp.
- Diff your request against the browser's, wire order to wire order, and fix every difference until the diff is empty.
- Use replay to learn how many calls a session survives, and set your rotation threshold under it.
- If a proxy is involved, set it as powhttp's upstream and run the browser-vs-script test to separate IP problems from code problems.
- Stuck? Export a HAR for the analyzer, or run the MCP server and let the plugin read the capture.
Finding the endpoint was never the hard part. Making your request indistinguishable from the browser's is, and powhttp is how you see whether you've actually done it.
FAQ
Why can't I just use Chrome DevTools or copy as cURL?
DevTools shows you a cleaned-up, re-sorted, human-friendly view of a request, not the bytes that went out on the wire. It alphabetizes headers, normalizes their case, and shows nothing about your TLS fingerprint. Those are exactly the three signals anti-bots like Akamai, DataDome, and Incapsula fingerprint. A cURL copied from DevTools teaches you which endpoint to call, not how the request has to look. powhttp captures the real wire so you can see and fix the difference.
Is powhttp free?
Yes, powhttp is in free beta. Download it from powhttp.com and install the build for your platform. It is still beta, so a few corners of the UI are rough and the documentation is thin, which is part of why we wrote this guide.
How is powhttp different from Charles, Fiddler, or mitmproxy?
It is the same category of local HTTPS debugging proxy, but two things matter for anti-bot work. First, powhttp barely touches your TLS fingerprint, where Charles rewrites the ClientHello enough that some anti-bots block Charles itself. Second, it shows the true wire order (header order, header case, and HTTP/2 pseudo-header order) exactly as sent, and its external-proxy support does not corrupt that ordering the way Charles' does.
Does powhttp work on macOS?
Yes, powhttp runs on both Windows and macOS, with a native arm64 build for Apple Silicon. On macOS it installs its root certificate into the system keychain. If a site still shows a certificate error, open Keychain Access and set the powhttp certificate to Always Trust.
This guide is provided for educational purposes. Screenshots reflect powhttp's beta UI and may change between releases.
Solve Akamai, DataDome, Incapsula and Kasada in one request
Skip the browser. Generate the sensor data, tokens and cookies you just read about over plain HTTP, with a free one-week trial.